
The DevOps Data Platform
Get fast, compliant data for testing application releases, modernization, cloud adoption, and AI/ML programs—all driven by APIs.
key offerings
use case
technology
industry
The DevOps Data Platform
Get fast, compliant data for testing application releases, modernization, cloud adoption, and AI/ML programs—all driven by APIs.
key offerings
use case
technology
industry
support
Introduction to Profiling Tools
In about a week, Paul and I will be presenting a tech talk at CMU where we will be demonstrating some performance tools (slides at dlpx.co/perftoolstalk). We decided to post a blog entry beforehand to give a taste of what we will cover and to give budding systems developers who couldn't make the talk a primer on some powerful tools for profiling and understanding their programs.
Share
In about a week, Paul and I will be presenting a tech talk at CMU where we will be demonstrating some performance tools (slides at dlpx.co/perftoolstalk). We decided to post a blog entry beforehand to give a taste of what we will cover and to give budding systems developers who couldn't make the talk a primer on some powerful tools for profiling and understanding their programs. In particular, we will cover the following tools: Google's gperftools (specificaly the CPU profiler pprof) Linux perf dtrace From CMU? Go to dlpx.co/cmu2013 to learn about our awesome fun CMU performance challenge!
gperftools
One of the most useful performance tools is a cpu instruction profiler. The most common cpu profilers tend to stop the program periodically and collect a stack trace (and perhaps other information). Google has a package of interesting profiling tools that includes a fairly nice sampling based cpu profiler. It is linked into your binary and emits output that can be later analyzed. There are 3 steps for using this tool: linking libprofiler into the binary, generating profile output by running the binary, and analyzing the output with pprof. The following links a binary with libprofiler:

For any binary linked with libprofiler, setting the environment variable CPUPROFILE enables profiling and specifies the output file. The following command runs ./a.out and prints profiling data to out.prof:

We can now analyze this file using pprof. Below, we output the sample counts for all the functions in a.out:
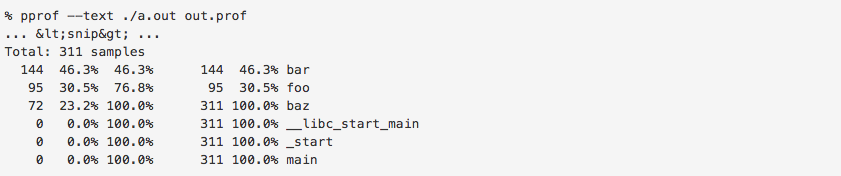
In this contrived case, we can see that 144 out of the 311 samples were taken while the program was executing bar and that the function foo was directly being executed 30.5% of the time, and was present in 76.8% of all stack traces sampled. In addition, pprof can provide annotated source output for debug binaries (and annotated assembly for all binaries). For example, 157 samples were taken when the following code was at line 68, indicating that this is probably a slow line:

Further, pprof can interact with other tools on your system to generate control flow graphs to help you understand the relationship between function calls. You can see an example of such output here - in this case, it appears that hash table accesses are a relatively expensive operation. This tool is very powerful and this is only a taste of what it can do. You can see full documentation here, and this is a phenomenal blog post demonstrating the use of pprof to analyze a go program.
perf
Perf is a profiling tool specific to Linux. Its unique (and extremely powerful!) feature is that it can access hardware counters to gather information. These hardware counters contain extremely low-level information about the system, like which instructions are causing cache misses. It can also function like a sampling-based cpu profiler. For example, the following snippet ran a.out and generated a report on common stats:

You can also use perf record and perf annotate to get instruction-by-instruction information about your code. To learn about this and other interesting features of perf, see the full documentation here. For an example of perf being used, you can check out this excellent analysis of a string comparison bottleneck in git gc.
dtrace
DTrace is an incredibly powerful tool for inspecting and instrumenting software. DTrace was invented for Solaris, but works with several major operating systems (including Mac OSX, BSD, and to some extent Linux). DTrace can be used to safely analyze a running production system, including the operating system, device drivers, database, and other applications. DTrace has a fairly simple interface. You can enable probes that will fire when specified events occur. For example, the following DTrace script enables a probe that is hit anytime the process with pid 142 calls malloc:

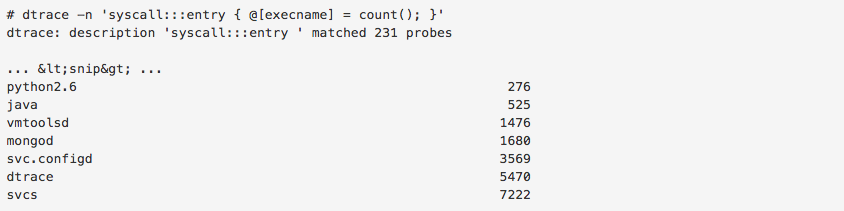
In addition, you can specify a block of code to be executed when a probe is hit. The following DTrace script tracks and dumps the number of syscalls each process makes:
Furthermore, it is possible to specify a predicate that can enable or disable a probe on the fly. The following DTrace script is a simple sampling base cpu profiler:
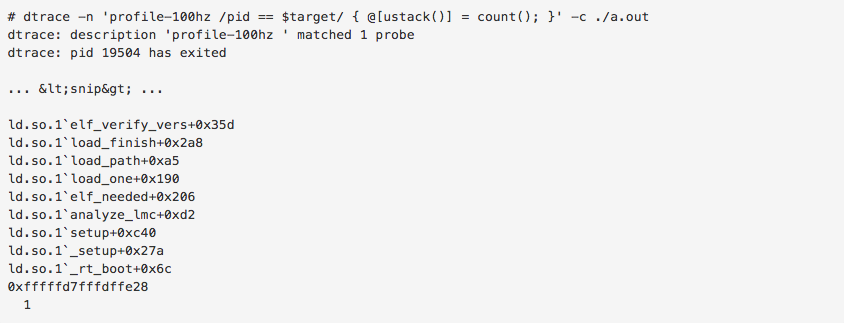
(Actually, this doesn't work in Mac OSX because the ustack implementation behaves strangely >.<). This is just a taste of what is possible in DTrace. We use DTrace a lot at Delphix because it is an incredibly powerful and flexible systems analysis tool. See more information at the official about page. For a hilarious example of DTrace being used in the wild, watch Shouting in the Datacenter.
What now?
Some other tools we find cool: Poor mans profiler.